A premium, high-performance, real-time monitoring dashboard designed for HORACO (HC-SWTGW218AS) and similar 8-Port + 2-Port SFP+ (10G) managed switches. The dashboard queries the switch’s native HTTP CGI interface, meaning no SNMP setup or configuration is required.
Built with a gorgeous, high-tech glassmorphic dark-mode interface, it features automatic rolling bandwidth history, persistent byte-delta tracking, MAC address table searches, on-demand optical transceiver telemetry (DDMI), and a built-in interactive API explorer.
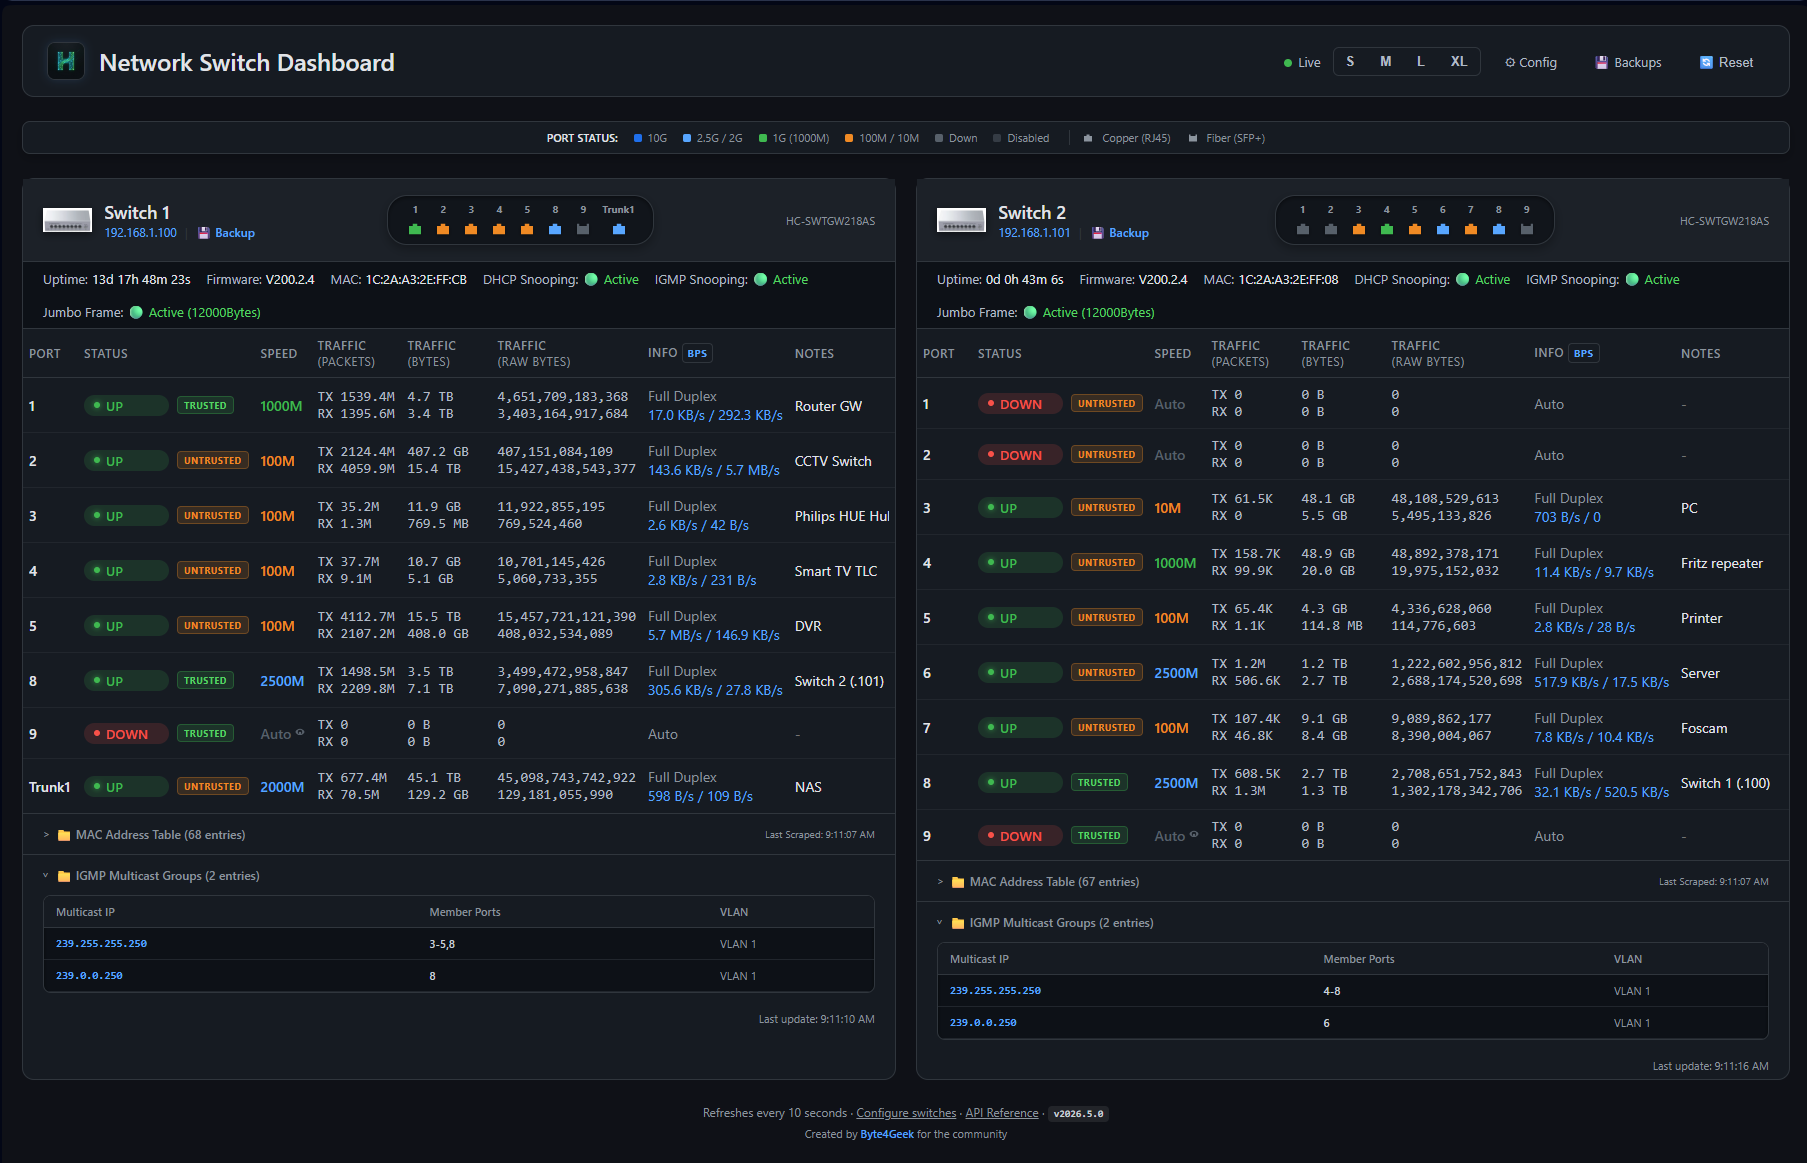
This dashboarb support these device:
- Stunning Dark Mode: Custom typography (Outfit/Inter/JetBrains Mono), harmonized color palettes, and frosted-glass components (
backdrop-filter: blur(12px)) that look amazing on operations consoles. - Micro-Animations: Dynamic state transitions, pulse loading indicators, and rotating refresh controls.
- Adaptive Grid Layout: Tailored viewports supporting smooth font scaling (S / M / L / XL) persisted directly to server settings.
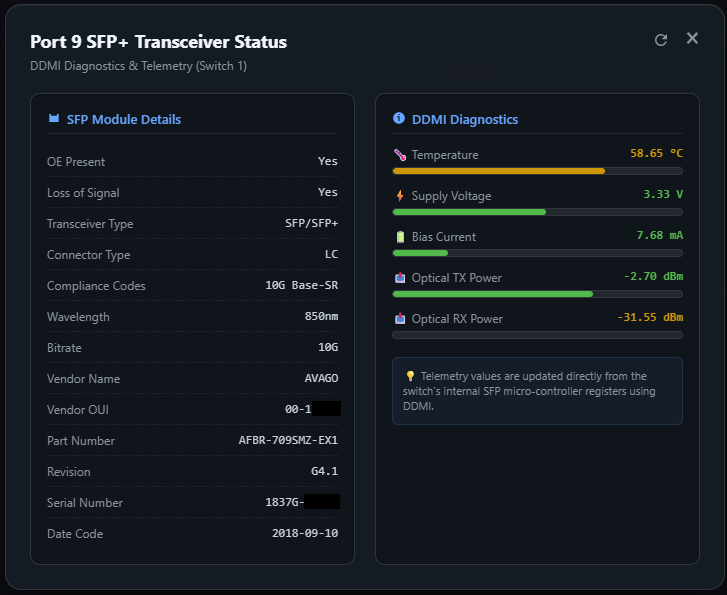
- Real-time Optical Sensors: Click the speed label of an SFP+ port (e.g. Port 9) to display physical module metadata (Vendor, Model, Serial, Compliances, Wavelength) and real-time DDMI diagnostics.
- Visual Telemetry Bars: Progress bars dynamically colored based on safe thresholds for:
- Temperature (°C)
- Supply Voltage (V)
- Bias Current (mA)
- TX/RX Optical Power (dBm)
- Dynamic Refresh Loop: Dedicated refresh button inside the modal to re-scrape physical hardware registers on-demand.
- Bs4 Malformed Parsing Fix: Custom pre-parsing sanitization engine handles malformed switch micro-controller HTML tables (like unclosed
<th>tags closed by</td>), ensuring perfect parsing.
- Multi-Scale Sparklines: Click any standard port speed to launch real-time bandwidth charts powered by Chart.js.
- Three-Tier Historical Ranges:
Live(High-resolution, real-time delta speed in bits per second)1-Hour(Rolling 1-hour average in Bytes per second)24-Hour(Rolling 24-hour average in 15-minute windows)
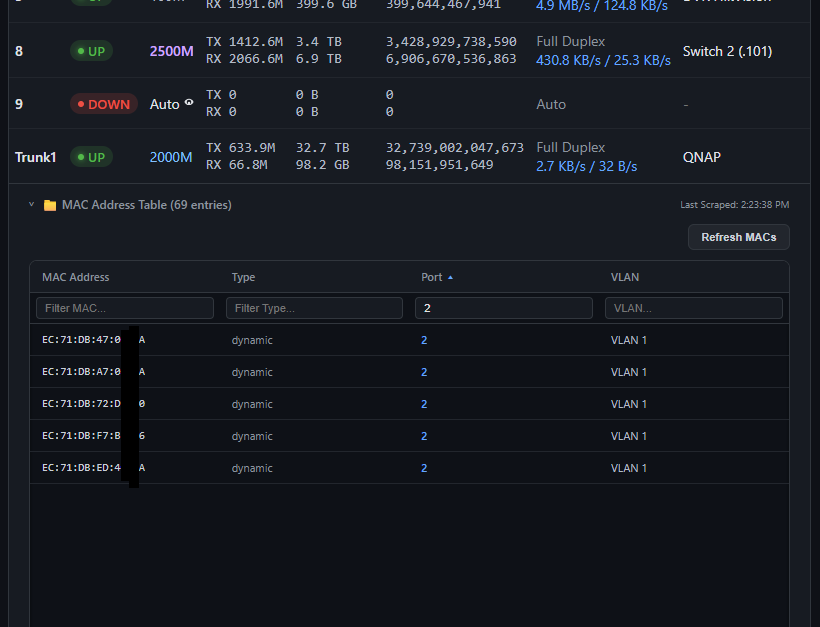
- Flexible Search & Filtering: Multi-column text filtering makes searching by VLAN, Port, MAC, or status trivial.
- Interactive Height Controls: Dynamically drag to resize table heights (saves user preference to
settings.jsonon disk). - Manual Re-indexing: On-demand POST request scraper forces active switches to dump fresh bridge routing entries.
- Multi-Switch Panel: Dynamically add, modify, or delete switches through a beautifully organized
/configroute. - Persistent Accumulation: Standard bytes counters are persistent across server reboots, complete with a delta tracking script to auto-detect and compensate for switch physical reboots without corrupting traffic metrics.
- Annotation Layer: Add custom, persistent labels/notes (e.g., "Uplink to NAS", "SmartTV") to any port.
- Built-in Docs: Hosted locally at
/api-docswith a beautiful, fast sidebar navigation. - Developer Resources: Contains interactive code cards, response payload previews, parameter grids, and copy-to-clipboard buttons for instant cURL examples.
- Global Configuration Tracking: Scrapes global enable state for DHCP Snooping and IGMP Snooping, rendering status badges directly on the dashboard.
- Port-Level Trust Badges: Real-time port trust classifications are fetched from
/port.cgito show customized untrusted and trusted labels. - IGMP Multicast Tables: Fully parsed multicast group database extracted from
/igmp.cgi?page=dumpdisplayed in an expandable glassmorphic table.
- Frame Size Scraper: Inspects
/fwd.cgi?page=jumboframeto retrieve Jumbo Frame configuration status and parse the exact selected frame size (e.g.9216Bytes).
- Config Backups: Safely triggers configuration archive downloads via
/config_back.cgi?cmd=conf_backup, storing them directly on the server's disk space. - Interactive Manager: Beautiful
/backupsinterface listing saved configs with quick downloads and single-click deletions protected by glassmorphic modal dialogues.
- Remote Power Cycle: Triggers a remote switch reboot via
/reboot.cgisecurely. - Safety Confirmation: Uses an immersive custom warning card modal using frosted glass backdrop effects, with real-time feedback loops during reboot execution.
graph TD
    A[User Browser] -- HTML5 / JS / Chart.js --> B[Flask Server: Port 8080]
    B -- Config / API Route --> C[Local Cache: config.json / counters.json]
    B -- Background Poller / Thread --> D[scraper.py]
    D -- HTTP POST Login / CGI Scrape --> E[Managed Switch: 192.168.1.100]
    E -- /info.cgi, /port.cgi, /transceiver.cgi --> D
    B -- Interactive Explorer --> F[API Reference: /api-docs]
- Backend: Flask (Python 3.9+), single-worker polling thread to prevent session thrashing.
- Frontend: Vanilla ES6 JS, Custom CSS (Aesthetic glassmorphism), Chart.js (multi-tier canvas).
- Scraper: Custom HTTP CookieJar scraper communicating with switch
/login.cgi,/info.cgi,/port.cgi?page=stats, and/transceiver.cgi.
- Python 3.9+
- Operating System: Linux with
systemd(Debian, Ubuntu, CentOS, Arch) or standalone Windows/macOS. - Network Access: Port 80 access to target managed switches (e.g. HORACO
HC-SWTGW218ASor OEM equivalents).
Our automated script handles the entire installation seamlessly, creating a dedicated Python virtual environment to avoid interfering with system packages.
# Clone the repository
git clone https://github.com/yourusername/switch-dashboard.git
cd switch-dashboard

# Run the installer as root
sudo bash install.sh
The script will:
- Copy all project files to
/opt/switch-dashboard/. - Check for system-level dependencies (
python3-pip,python3-venv). - Set up a secure virtual environment inside
/opt/switch-dashboard/venv. - Install all requirements (
Flask,BeautifulSoup4). - Generate and register a
switch-dashboard.servicewithsystemd. - Start and enable the service on boot.
Once completed, the dashboard is live at:
- Dashboard:
http://<your-ip>:8080 - API Documentation:
http://<your-ip>:8080/api-docs
You can deploy the Switch Dashboard as a lightweight Docker container. All persistent configurations, history files, and switch backups are managed inside a single volume or host directory mapping.
The dashboard keeps its state in several files and a backup folder:
- Configurations & Settings:
config.json,settings.json,notes.json - Bandwidth & Counters:
counters.json,history_hourly.json,history_daily.json - Switch Backups:
/backup/subdirectory
All of the above items are unified under the path specified by the DASHBOARD_DATA_DIR environment variable (defaults to /data in the container). You only need to mount/persist this single folder!
A pre-configured docker-compose.yml is provided in the repository.
-
Clone the repository:
git clone https://github.com/yourusername/switch-dashboard.git cd switch-dashboard -
Configure your switches: You can either edit
config.jsonbefore running the container, or simply let the container initialize the defaultconfig.jsoninside the mounted volume directory (./data), and then edit it there or via the dashboard's/configpage. -
Start the container:
docker compose up -d
-
Access the dashboard: Go to
http://<your-ip>:8080in your web browser. All your configs, notes, backups, and charts history will be persisted in the local./datafolder on the host.
To run the container manually with the Docker CLI:
-
Build the image:
docker build -t switch-dashboard . -
Run the container with a volume:
docker run -d \
  --name switch-dashboard \
  --restart unless-stopped \
  -p 8080:8080 \
  -v /absolute/path/to/your/data:/data \
  -e DASHBOARD_DATA_DIR=/data \
  switch-dashboard
Replace
/absolute/path/to/your/datawith the actual directory path on your host where you want to store your persistent data.
If you prefer to configure the dashboard manually or want to run it on non-systemd machines (Windows / macOS):
python3 -m venv venv
source venv/bin/activate
pip install -r requirements.txtCreate or edit /opt/switch-dashboard/config.json:
{
  "title": "Network Command Center",
  "refresh_interval": 10,
  "mac_refresh_multiplier": 5,
  "switches": [
    {
      "name": "HORACO Core",
      "ip": "192.168.1.100",
      "username": "admin",
      "password": "admin",
      "model": "HC-SWTGW218AS",
      "port_count": 9
    }
  ]
}python3 app.pyThe dashboard includes a set of REST endpoints. For complete details, response payloads, and copyable cURL examples, navigate to the /api-docs route.
| Method | Endpoint | Description |
|---|---|---|
GET |
/api/switches |
Returns live status of all switches and ports, including custom notes. |
GET |
/api/switches/<ip>/transceiver |
Returns parsed SFP module diagnostics and DDMI telemetry. |
POST |
/api/switches/<ip>/refresh_mac |
Forces an immediate scrape and returns the active MAC forwarding table. |
GET |
/api/speeds |
Returns real-time delta speed states (Bytes/s, bps) for active interfaces. |
GET |
/api/history |
Returns high-res historical statistics for Chart.js (live, 1h, 24h). |
POST |
/api/notes |
Attaches a persistent label/description to a port (saves to notes.json). |
GET |
/api/settings |
Retrieves global UI preferences (e.g., base font scale). |
POST |
/api/settings |
Updates global UI settings on the disk. |
POST |
/api/reset |
Purges cumulative logs and bandwidth cache, resetting delta Baselines. |
POST |
/api/switches/<ip>/backup |
Triggers a configuration backup and saves the binary archive to the server's disk. |
POST |
/api/switches/<ip>/reboot |
Safely sends a reboot trigger to the physical switch hardware. |
GET |
/api/backups |
Lists all configuration backups stored on the server. |
GET |
/api/backups/<filename>/download |
Downloads a specific saved switch configuration file. |
DELETE |
/api/backups/<filename> |
Deletes a specific switch configuration file from the server. |
GET |
/backups |
Returns the HTML template for the backups manager dashboard. |
/opt/switch-dashboard/
├── app.py              # Flask core service, poller thread, and REST API routes
├── scraper.py          # Switch scraping engine, custom login cookie session, and tags cleaner
├── config.json         # User-defined switches, polling intervals, and general configuration
├── counters.json       # Persistent cumulative traffic database
├── notes.json          # Persistent custom port descriptions
├── settings.json       # Persisted user UI configurations (e.g. font sizes, table dimensions)
├── install.sh          # Self-healing, multi-distro Linux automated systemd installer
├── requirements.txt    # Python package dependencies
├── templates/
│   ├── index.html      # Main high-tech glassmorphic dashboard
│   ├── config.html     # Switch configurator interface
│   └── api_docs.html   # Premium built-in developer documentation manual
└── static/
    ├── style.css       # Premium core CSS tokens, custom dark scrollbars, and layouts
    ├── app.js          # Core front-end logic, rendering engine, Chart.js mapping
    └── logo.png        # Horaco brand assets
This project is licensed under the MIT License. Feel free to modify, distribute, or incorporate it into your network setup.
- 🩹 Dynamic Switch Model Fallback:
- Fixed a bug where switches that do not explicitly report their model inside
/info.cgi(such asLIANGUO LG-SG5T1) incorrectly fell back to a hardcoded"HC-SWTGW218AS"model name in the UI. The scraper now dynamically falls back to the exact model name specified inconfig.json. - Changed the default fallback in
scraper.py(when the"model"attribute is omitted fromconfig.jsonentirely) to a clean, generic"Generic Model"string to avoid any brand confusion.
- Fixed a bug where switches that do not explicitly report their model inside
- 🐳 Docker & Docker Compose Support:
- Implemented lightweight Docker containerization using a standard
Dockerfilebuilt onpython:3.11-slimand a unifieddocker-compose.yml.
- Implemented lightweight Docker containerization using a standard
- 💾 Unified Persistent Storage Mapping:
- Conserved configurations, notes, speed history, and backups inside a single
/datafolder inside the container mapped to a custom environment variableDASHBOARD_DATA_DIR.
- Conserved configurations, notes, speed history, and backups inside a single
- 🛡️ Auto-Initialization Safeguard:
- Automatically initializes volume directories with default configuration files upon startup if mapped to empty host folders to avoid container crash loops.
- 📦 Absolute Resource Pathing:
- Configured Flask absolute template and static directories dynamically to resolve relative directory conflicts inside Docker environments.
- 🎨 Administrative Port Contrast & Legend Integration:
- Outlined administratively disabled ports in the graphical representation using a unique, premium dark-grey (
#353c45) to distinguish them from standard offline ports (#57606a). - Integrated the new Disabled status label and color badge directly into the central
PORT STATUSlegend.
- Outlined administratively disabled ports in the graphical representation using a unique, premium dark-grey (
- 🔒 Administrative Port Status Scraping:
- Upgraded scraping engine to fetch
/port.cgiand parse active configuration states, accurately reportingDISABLEstatus instead of misleading physical link states.
- Upgraded scraping engine to fetch
- 🔄 Safe Device Reboot Modal:
- Implemented secure switch reboots via
/reboot.cgiwith an immersive glassmorphic warning modal to protect users from accidental network disruption.
- Implemented secure switch reboots via
- 💾 Configuration Backup Manager:
- Added on-demand server-side configuration backups (
.binfiles) with an interactive dashboard to download, view, and safely delete configurations.
- Added on-demand server-side configuration backups (
- 🟢 Snooping & Multicast Telemetry Integration:
- Integrated global and port-level status for DHCP Snooping, IGMP Snooping (with collapsible multicast table), and Jumbo Frame size properties.
- 🎨 Visual Color Harmonization:
- Aligned table port speed texts (
colonna speed) with matching port status indicators in the graphics bar.
- Aligned table port speed texts (
- 📋 Interactive API Reference Expansion:
- Documented reboot and backups endpoints in the interactive local
/api-docsinterface.
- Documented reboot and backups endpoints in the interactive local
Buy me a coffee
