
Stop guessing how fast your model is. Watch it.
A tiny always-on-top bar for OpenCode V2 that shows one honest line for the session you are working in: turns, steps, the average streaming tokens per second, and the average of the last ten responses beside it.




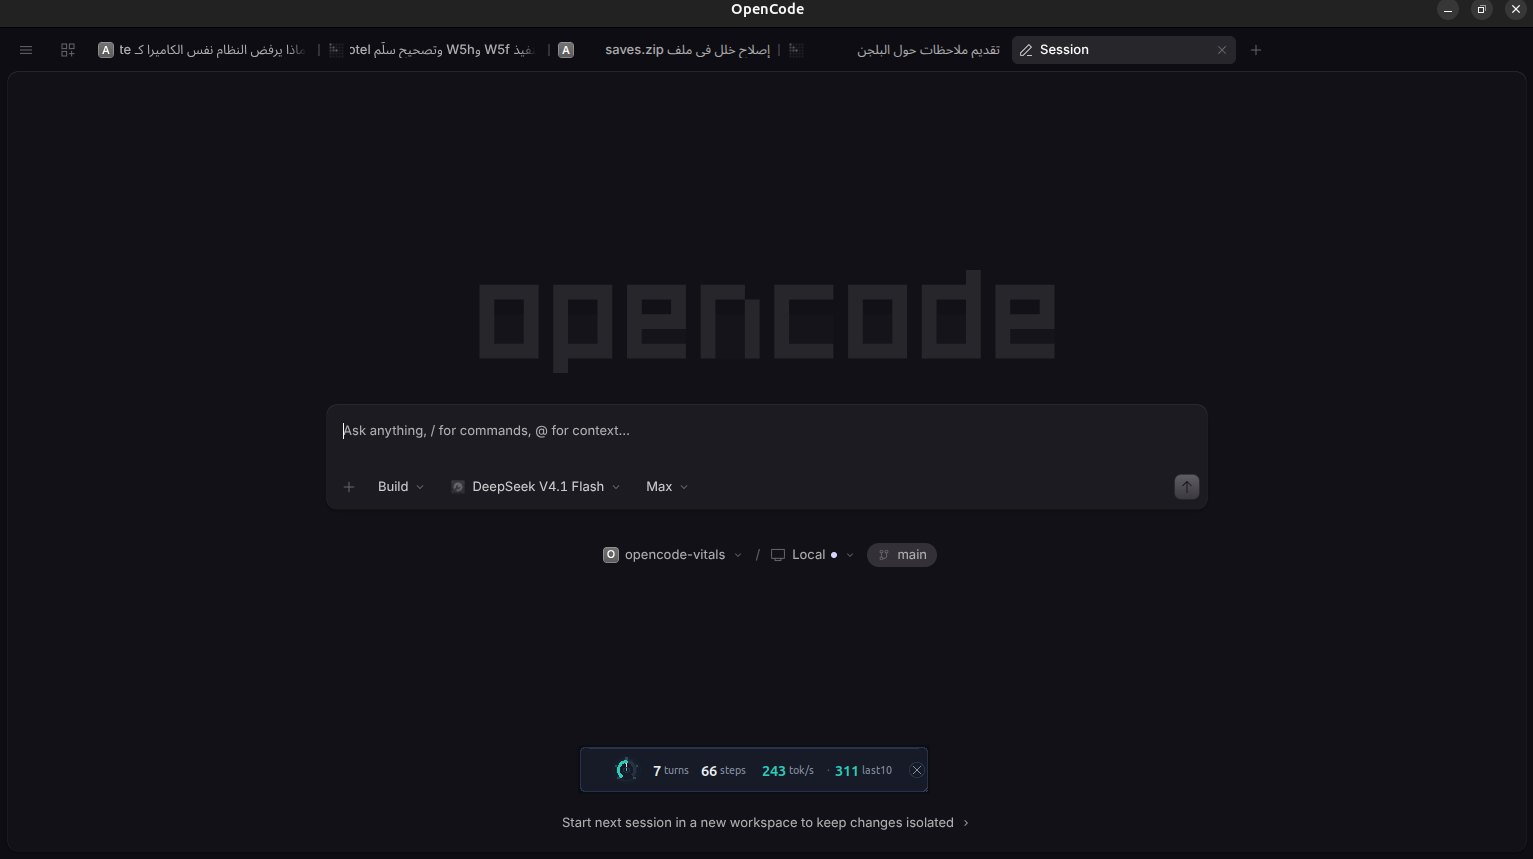
The bar over a live session on a real desktop: 7 turns · 66 steps · 243 tok/s · 311 last10.
1 — Check your machine first. It takes ten seconds and tells you whether the bar can run here:
npx opencode-vitals selftest2 — Install it with one command:
npx opencode-vitals installThat copies the plugin into the folder OpenCode already looks in, and prints the path it used. It
never touches your configuration file, and it makes no network calls: the package it installs is the
one npx just downloaded.
3 — Restart OpenCode. The bar is on screen within seconds.
Add one line to opencode.json or opencode.jsonc instead, and OpenCode installs and updates the
package itself:
Or copy the folder to ~/.config/opencode/plugins/opencode-vitals/ and OpenCode finds it with no
command at all. Want to change the history size or turn the bar off? Use the object form in
Options.
npx opencode-vitals # install into the plugin directory
npx opencode-vitals install # the same, said out loud
npx opencode-vitals selftest # can this machine draw the bar?
npx opencode-vitals status # what is installed, and which version
npx opencode-vitals uninstall # remove it again
npx opencode-vitals install --link # symlink instead, while working on the source
npx opencode-vitals install --dir PATH # use a plugin directory you choosenpx resolves package names, not the names of the files inside them, so the command has to be
npx opencode-vitals <what>. The two older names still exist for scripts that add the package to a
project: opencode-vitals-install and opencode-vitals-selftest (run them through npm as
npm exec --package=opencode-vitals -- opencode-vitals-install).
Installing twice updates in place and removes files that a newer release no longer ships. It refuses
to replace a directory that holds a different package unless you pass --force, and it will not write
outside the plugin directory. --uninstall refuses to remove a folder that does not carry this
package's manifest unless you add --force too.
The plugin directory is the one OpenCode itself reads — $XDG_CONFIG_HOME/opencode/plugins, or
~/.config/opencode/plugins when that variable is unset — on every platform, Windows included
(verified against the shipped CLI, which computes the same path). The path used is printed, so a
different setup is visible rather than silent.
Do not run npm install opencode-vitals. OpenCode resolves and installs npm plugins itself at
startup — on this machine each package lands in
~/.cache/opencode/npm/opencode-vitals@latest/<timestamp>/. A copy you install into a project's
node_modules is not what gets loaded, so it only leaves a second, stale copy on your disk. The
config line is the whole install.
You can feel that a session got slower. You cannot see it.
Every dashboard OpenCode ships answers a different question — cost, token count, context size — and none of them answer the one you actually have while you work: is this session fast, and is it getting slower? Model output arrives in a stream, so the number that matters is throughput while the model is generating, not the wall-clock time of a turn that also ran a build, a test, and three tool calls.
OpenCode Vitals puts that number on your screen, in the corner, all session long.
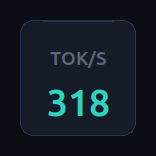
◔ 34 turns 210 steps 318 tok/s · 331 last10 resp
Every feature, in one place:
| Feature | What it does |
|---|---|
| Session average | Turns, steps and average streaming tok/s for the session you are looking at, so one fast reply cannot flatter a long session. |
| Last ten responses | · N last10 resp is the mean of the rates of the last ten completed responses, next to the session average. The session average is the whole session divided as one sum; this one moves as soon as a slow reply lands, which is what tells you the session just changed character. A response with no honest rate is skipped, not counted as a zero. It counts responses, not steps: the steps inside one reply are not ten separate answers, and averaging them would answer a question nobody asked. |
| Subagent work is counted | A subagent runs as a session of its own, so its steps and tokens are added to the session that delegated the work. Its own streaming time is not — the session's tok/s stays a speed that session actually ran at, and the subagent's own rate stays on its own session. |
| Your project, your numbers | Every OpenCode instance on the machine shares one status directory. The bar is told which project spawned it and shows only that project's sessions. A session with nothing measured yet says so instead of displaying another session's totals. |
| Always on top | 450×54 pixels by default, undecorated, no taskbar entry, no focus steal, slightly transparent. |
| Any size you like | Drag the bottom-right grip to resize, or hold Ctrl and use the wheel. Everything scales together — card, dial and text — the aspect ratio stays, and the size is remembered. Right-click resets it to 100%. |
| Move it anywhere | Drag the body; the position is remembered. OPENCODE_LATENCY_POSITION picks the first corner instead. |
| Collapse | Click the × and the bar shrinks to a small square that keeps showing tok/s; click the square to bring it back. The collapsed bar scales with the same size setting. |
| It follows your tab | Switch sessions in the Desktop app and the bar switches with it (reads one row, tabs.recent, read-only). |
| It follows your attention | Minimize the OpenCode window, switch to another program, or let a window cover OpenCode, and the bar steps aside; come back and it returns. Linux/X11, and fail-open: when it cannot tell, the bar stays. |
| It leaves when you do | Close OpenCode and the bar exits with it; nothing is left on screen. It also stands down 10 seconds after the last event from a session, so a service that is running but idle is not a bar you have to close by hand. Any event counts, not just a finished reply: a response that is still streaming keeps the bar up, because that is when its numbers are worth reading. |
| It tells you when it updated | A new version announces itself once, in place of the numbers. |
| You can check what is running | npx opencode-vitals selftest prints the loaded version, the previous one, and every fact the bar depends on. |
No estimates, no invented numbers. Every value is read from OpenCode's own event stream.
| Number | What it is |
|---|---|
| turns | Responses completed in this session. |
| steps | Model steps across those responses, so a response that called tools five times is not mistaken for a fast one. |
| tok/s | generated tokens ÷ active stream time, where generated tokens are output plus reasoning tokens, and active stream time is the time the model was actually streaming. Tool executions between steps stay out of the denominator. |
How the denominator is chosen, and what each record says about it (rateSource):
rateSource |
The stream time used |
|---|---|
stream-span |
The real streaming span: from the first delta of a message to its last, summed over the messages of that response. |
first-to-last |
The reply arrived as one piece with no measurable span, so the time from its first token to its last is used. |
single-message-total |
The same, and the whole turn was that one message and one step: its own wall time is used. |
unavailable |
No honest denominator exists (a multi-message or multi-step response with no measurable stream, i.e. mostly tool time), so tok/s stays –. |
What counts as model time, and what does not:
| Measured as model time | Not measured |
|---|---|
Text deltas (session.text.delta) |
Running a tool (session.tool.called/success), however fast or slow |
Thinking deltas (session.reasoning.delta) |
Waiting in a queue, compaction, synthetic items |
The model writing a tool call's arguments (session.tool.input.delta) |
Anything the provider never reports |
That last row is what makes the number honest: a step's token count includes the tokens it spends
writing a tool call, so the time spent writing them has to be in the denominator too. Skipping it
used to print 4686 tok/s on a real turn whose only visible text was 80 characters.
A silence longer than 30 seconds under one message is a dropped connection coming back, not a slow model, so the span restarts there instead of counting the gap. Session totals are replaced as a whole snapshot rather than field by field: the tokens of one moment are never divided by the stream time of another.
Deliberately excluded, because including them would flatter the number:
- Compaction executions and synthetic inbox items — they are not your work.
- Duplicate completions, late deltas, and repeated plugin instances — deduplicated by event and response identity, so a reconnect cannot inflate a session.
- Wall-clock turn time — it mixes model thinking with your tools.
- Parallel and subagent executions — a second execution starting while one is open closes the first, so two answers running at once are two turns instead of one inflated one.
Events this plugin does not recognise are counted and reported on the record
(unknownEventTypes) rather than dropped in silence: a renamed or removed OpenCode event would
otherwise delete measurements with no error anywhere. Events that are known but not part of the
measurement — running tools, shells, skills, interface state — are listed as ignored and never
reported.
If the provider reports no token counts, tok/s shows – instead of guessing. Per-turn detail
(firstTokenMs, firstTextMs, firstCharMs, totalMs, activeStreamMs, toolArgCharacters,
rateSource, per-model and per-agent token counts) stays in the plugin's own storage, capped at 100
records, if you want to compute something else.
OpenCode installs npm plugins itself with Bun at startup, so installing is one config entry and a restart.
// opencode.json or opencode.jsonc
{
"$schema": "https://opencode.ai/config.json",
"plugins": [
{
"package": "opencode-vitals",
"options": {
"popup": true
}
}
]
}{
"$schema": "https://opencode.ai/config.json",
"plugins": ["opencode-vitals"]
}Restart OpenCode and the bar is there within seconds.
Files in the plugin directory are loaded automatically, with no configuration at all:
mkdir -p ~/.config/opencode/plugins
cp -r opencode-vitals ~/.config/opencode/plugins/opencode-vitalsgit clone https://github.com/moutazideal/opencode-vitals.git
ln -s "$PWD/opencode-vitals" ~/.config/opencode/plugins/opencode-vitalsEdits reach the running plugin within five seconds — no restart. Keep the link under the folder name OpenCode already discovered, or the running instance will be left pointing at nothing.
| OpenCode | V2 (developed against 2.0.14, 2.0.16 and 2.0.18) |
| Node | 18 or newer, for the plugin |
| Python | 3.9+ with tkinter, for the bar |
| Packages to install | none |
tkinter ships with the official Python installers on Windows and macOS. On Debian/Ubuntu it is the
small python3-tk package, usually already present on a desktop machine. On a headless server
(SSH, CI, container) the bar is skipped and measurement still runs.
Being straight about this, because "works everywhere" is usually a claim nobody checked:
| Linux | macOS | Windows | |
|---|---|---|---|
| Measurement core | tested | same code, no OS calls | same code, no OS calls |
| Bar window | tested — GNOME/Mutter on X11: undecorated managed window, _NET_WM_STATE_ABOVE, drag, collapse, saved position |
expected — Tk undecorated + topmost; best-effort against fullscreen apps | expected — Tk undecorated + topmost |
| Follows the open tab | tested — ~/.config/ai.opencode.desktop/drafts.sqlite |
~/Library/Application Support/… (Electron convention) |
%APPDATA%\… (Electron convention) |
| Leaves with the app | tested — /proc scan |
pgrep per name |
tasklist per name |
| Follows the window | tested — _NET_WM_STATE via xprop: the bar hides while the window is minimized and returns when it is restored |
not implemented — the bar stays up | not implemented — the bar stays up |
| Follows your attention | tested — _NET_ACTIVE_WINDOW for focus and _NET_CLIENT_LIST_STACKING plus window geometry for a covering window; fail-open when either cannot be read |
not implemented — the bar stays up | not implemented — the bar stays up |
| Resize (grip, Ctrl+wheel) | tested — works anywhere Tk draws | expected — same code | expected — same code |
Only the Linux column has run on real hardware. The macOS and Windows paths are ordinary platform code with one rule that matters: when a check cannot run, the bar stays instead of disappearing. Run the selftest on your machine and you will know in ten seconds.
npx opencode-vitals selftest # after installing from npm
node selftest.mjs # from a clone
python3 selftest.py # with Python directlyopencode-vitals selftest — Linux 7.0.0-34-generic (linux)
python 3.12.3 at /usr/bin/python3
ok tkinter available
ok Tk runtime present — Tk 8.6, Tcl 8.6
ok a window system is reachable — DISPLAY=:0
ok a preferred font exists — Ubuntu
ok topmost window accepted — type=toolbar, topmost=1
ok window transparency accepted — -alpha 0.96
ok undecorated window type chosen — toolbar
ok Desktop state database found — /home/you/.config/ai.opencode.desktop/drafts.sqlite
ok open tab read from the database — ses_example0000000000000001
ok plugin installed on disk — /home/you/.config/opencode/plugins/opencode-vitals
ok plugin status file present — /tmp/opencode-latency-monitor/latest.json
ok session totals readable — 2 session(s)
ok a bar instance is running — pid 12345
ok plugin version recorded — running 0.1.5, package 0.1.5
13/13 required checks passed, plus 1 note
Ready: the bar is running on this machine.
Every line is a measured fact, not an assumption. Only the checks of what this machine can do are required; runtime facts are reported as notes, so a plugin that is not installed yet is never reported as an untrustworthy machine — the command says so and points at the install command. A report from another operating system is worth sending with a bug.
| Option | Default | What it does |
|---|---|---|
popup |
true |
Show the bar. false keeps measuring with no window. |
historyLimit |
20 |
Measurements kept in storage, 1–100. |
log |
false |
Log one line per measurement through OpenCode's logger. Errors and version changes are printed either way. |
enabled |
true |
Master switch. |
{
"plugins": [
{
"package": "opencode-vitals",
"options": { "historyLimit": 50, "log": true, "popup": true, "enabled": true }
}
]
}Environment variables, for the bar and for the curious:
| Variable | Default | What it does |
|---|---|---|
OPENCODE_LATENCY_PYTHON |
detected | Interpreter used for the bar, instead of probing python3/python/py. |
OPENCODE_LATENCY_POSITION |
top-right |
Where the bar first appears: top-right, top-left, bottom-right, bottom-left. |
OPENCODE_LATENCY_SCALE |
remembered | Size multiplier, 0.6–2.5. Overrides the size the user dragged. |
OPENCODE_LATENCY_HIDE_UNFOCUSED |
1 |
0 keeps the bar visible when another program takes focus. |
OPENCODE_LATENCY_HIDE_OCCLUDED |
1 |
0 keeps the bar visible when another window covers OpenCode. |
OPENCODE_LATENCY_DESKTOP_DB |
detected | Where the Desktop app keeps its state database. |
OPENCODE_LATENCY_PROJECT |
set by the plugin | The project this bar serves. Set by the plugin; setting it by hand pins one project's numbers on the screen. |
The bar's own files (OPENCODE_LATENCY_FILE, OPENCODE_LATENCY_CURRENT_FILE,
OPENCODE_LATENCY_TOTALS_FILE, OPENCODE_LATENCY_BEST_TOTALS_FILE, OPENCODE_LATENCY_POSITION_FILE,
OPENCODE_LATENCY_SCALE_FILE, OPENCODE_LATENCY_VERSION_FILE,
OPENCODE_LATENCY_LOCK_FILE, OPENCODE_LATENCY_PARENT_PID) exist so the bar can be run against an
isolated directory — the test suite uses them — and rarely need to be set by hand.
This plugin has no network code at all. No registry calls, no analytics, no telemetry, no update pings. It reads OpenCode's own event stream and writes a handful of small JSON files under your system temporary directory.
- Prompts and responses are never stored. Only counts, timings, model and agent names, and session/message identifiers. The last-ten reading is a list of numbers and nothing else.
- One deliberate exception, and you can switch it off by moving the file: to know which tab you
are looking at, the bar reads a single row (
tabs.recent) from the Desktop app's own state database, opened read-only. No draft text is read. PointOPENCODE_LATENCY_DESKTOP_DBsomewhere else, or let the file disappear, and the bar falls back to "the session you last typed in". - Nothing survives a restart except the numbers. The status directory is plain files in
/tmp-style temporary storage, and stale response markers are swept on a timer rather than waiting for your next message.
How you update depends on how you installed it.
| How you installed it | How to update |
|---|---|
npx opencode-vitals install |
Run the same command again. It updates in place. |
npx opencode-vitals install --link |
git pull in the checkout; the link picks it up. |
"plugins": ["opencode-vitals"] |
OpenCode owns the copy: it resolves the package at startup into ~/.cache/opencode/npm/opencode-vitals@latest/<timestamp>/. Quit and reopen OpenCode after a new version is published, then check the version below. |
| Copied the folder | Replace the files with the new release. The running plugin picks them up within about five seconds. |
npm view opencode-vitals version # what is published now
ls -d ~/.cache/opencode/npm/opencode-vitals@latest/* 2>/dev/null # what OpenCode holdsOpenCode has its own update setting — "update": "notify" | "auto" | "disable", defaulting to
notify — and its documentation states that an automatic install does not restart a running
server, so something has to restart for a new copy to take effect. Whether that setting also covers
plugins is not something this project has verified.
Do not assume an update landed. The selftest prints the loaded version, and the bar says so out loud:
npx opencode-vitals selftestok plugin version recorded — running 0.1.5, package 0.1.5
If it still reports the old version, OpenCode reused its cached snapshot. That is the normal case
after a plain restart: each package keeps a single <timestamp> directory in the cache, and on this
machine several application restarts produced no second snapshot, so a restart alone is not proof of
a refresh. Quit OpenCode, and if the version still has not moved, stop the leftover sidecar process
— the opencode-cli serve --service process — and launch OpenCode again, then run the selftest once
more. On Linux that service is supervised by systemd and can outlive the app window, which is why
reopening the window is not always enough.
When the module is evaluated it compares its own package.json version with the one it recorded in
plugin-version.json, with no network call involved:
- the bar shows
0.2.0 installedfor eight seconds, exactly once — even if the update landed while OpenCode was closed; - the plugin log reads
updated 0.1.5 -> 0.2.0; - the selftest prints
running <new>, package <new>and the previous version when there was one.
npm test # 223 plugin checks + 135 bar checks
npm run selftest # does the bar work on this machine?
npm pack # build the publishable tarball
npm run prepublishOnly # what publish runs firstopencode-vitals/
├── index.js the plugin: events, accounting, storage
├── bar.py the bar: Tkinter, standard library only
├── cli.mjs npx opencode-vitals (install, selftest, status, uninstall)
├── install.mjs the installer itself
├── selftest.mjs launcher that finds a Python with tkinter
├── selftest.py per-machine diagnosis
├── start-bar.sh run the bar by hand
└── tests/
├── vitals.test.mjs plugin logic
└── bar.test.py bar behaviour, lock, Desktop tab tracking
The test suite includes the mistakes worth catching twice: zombie holders in the singleton lock, a session with no totals yet (which must fall back to the last measurement instead of claiming zero work), a WAL write that leaves the database timestamp untouched, process checks on macOS and Windows driven by a fake process list so their logic is verified even though their hardware was not, a turn whose tokens were counted while the time spent writing its tool call was not, and a window that covers OpenCode while focus never left it.
MIT. See LICENSE.
{
  "$schema": "https://opencode.ai/config.json",
  "plugins": ["opencode-vitals"]
}