
See what your Rust values hold, not how they're stored.
A derive macro that embeds GDB and LLDB visualizers for your types.



Quick start · In a library · Attributes · Support · How it works
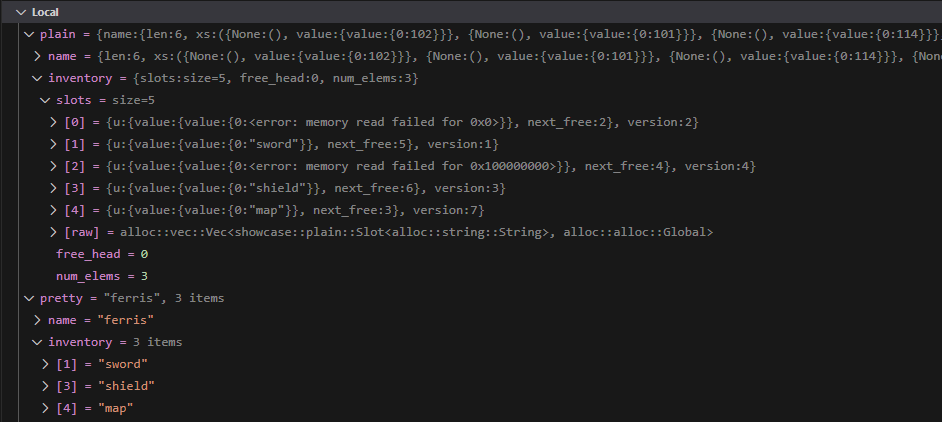
The same data twice, from examples/showcase.rs. Above: plain types, with the debugger failing on the slot map's empty slots. Below: the same types with #[derive(Debuggable)].
A debugger shows how a type is stored: raw pointers, capacities, bookkeeping fields, slots that
aren't in use. Usually you want to see what the value holds. With debuggable you write that
down once, next to the type, and GDB, LLDB and VS Code show it that way, for you and for anyone
who uses your crate.
This is all it took for the screenshot above:
use debuggable::Debuggable;
use std::mem::MaybeUninit;

#[derive(Debuggable)]
#[debuggable(summary = "{num_elems} items")]
pub struct SlotMap<T> {
    #[debuggable(items, only = "version & 1", value = "u.value")]  // slots in use, as their values
    slots: Vec<Slot<T>>,
    #[debuggable(hide)]
    free_head: u32,
    #[debuggable(hide)]
    num_elems: u32,
}

#[derive(Debuggable)]
#[debuggable(summary = "{xs}")]                                     // shown as just "ferris"
pub struct InlineString<const N: usize> {
    #[debuggable(hide)]
    len: u8,
    #[debuggable(text, len = "len", hide)]                          // the first `len` bytes, as text
    xs: [MaybeUninit<u8>; N],
}1. Add the crate
cargo add debuggable2. Derive it on your types and say what matters: a summary, fields to hide, a collection's
items. All of it is optional; see Attributes.
#[derive(Debuggable)]
#[debuggable(summary = "{len}/{cap}")]
pub struct RawBuf {
    #[debuggable(items, len = "len")]
    ptr: NonNull<u16>,
    len: usize,
    cap: usize,
}
(gdb) print buf without
$1 = my_crate::RawBuf {ptr: core::ptr::non_null::NonNull<u16> {pointer: 0x5555555aded0}, len: 3, cap: 4}
(gdb) print buf with
$1 = 3/4 = {len = 3, cap = 4, [0] = 10, [1] = 20, [2] = 30}
Mistakes are compile errors:
error: summary refers to unknown field `lenght`; did you mean `length`?
 --> src/lib.rs:2:24
  |
2 | #[debuggable(summary = "{lenght} items")]
  |                        ^^^^^^^^^^^^^^^^
3. Set up your debugger, once per machine (and for GDB, once per project):
cargo install cargo-debuggable
cargo debuggable setup --dry-run   # show what would change
cargo debuggable setup
setup configures whichever of GDB, LLDB and VS Code (CodeLLDB) you have installed. It only
edits marked blocks in their config files, backs each file up before the first change, and
cargo debuggable setup --remove takes everything out again.
4. Debug as usual: rust-gdb, rust-lldb, lldb, or F5 in VS Code with CodeLLDB.
If a type still shows raw, cargo debuggable doctor target/debug/my-app checks the debuggers,
their configuration and the binary, and says what to change. See also
troubleshooting.
More examples: enums, nested types, LLDB output
#[derive(Debuggable)]
pub enum Token {
    #[debuggable(summary = "Ident({name})")]
    Ident { name: String },
    #[debuggable(summary = "Num({0})")]
    Num(i64),
    Eof,                                // no summary: shown as `Eof`
}

#[derive(Debuggable)]
#[debuggable(summary = "{len} items")]
pub struct SlotMap<K, V> {
    #[debuggable(items, len = "len")]   // only the first `len` slots
    slots: Vec<Slot<V>>,
    #[debuggable(hide)]
    free_head: u32,
    #[debuggable(hide)]
    len: u32,
    _k: PhantomData<K>,                 // PhantomData is hidden automatically
}

#[derive(Debuggable)]
#[debuggable(summary = "v{version} {value}")]
pub struct Slot<V> {
    value: Option<V>,
    #[debuggable(hide)]
    version: u32,
}
(lldb) v map without
(my_crate::SlotMap<u8, alloc::string::String>) map = {
slots = size=3 {
[0] = {...}
[1] = {...}
[2] = {...}
}
free_head = 3
len = 2
_k =
}
(lldb) v map with
(my_crate::SlotMap<u8, alloc::string::String>) map = 2 items {
[0] = v1 Some("alpha") {...}
[1] = v3 Some("beta") {...}
}
A field that is itself Debuggable shows its own summary, so Slot above appears as
v1 Some("alpha") inside the map. ({...} is a collapsed value.)
Derive it on your public types and your users get the visualizers with no work per type: the
descriptions are compiled into their binaries along with your types. They run
cargo debuggable setup once, like any user above.
| What it costs them | |
|---|---|
| Binary size | About 300 bytes per derived type, plus about 6 KB once per Linux binary for the GDB runtime. It is data in a section only debuggers read; no code runs in the program. RUSTFLAGS="--cfg debuggable_disable" leaves it all out. |
| Compile time | About 1 ms per derived type, measured on rebuilds without incremental compilation and checked in CI. The derive uses syn 3, which many projects already build for serde, tokio, thiserror or clap. |
| Code | No unsafe in your crate. Works with no_std and #![forbid(unsafe_code)]. |
| MSRV | Rust 1.75. |
If you'd rather not add a dependency for everyone, make it an optional feature:
[dependencies]
debuggable = { version = "0.1", optional = true }#[cfg_attr(feature = "debuggable", derive(debuggable::Debuggable))]
#[cfg_attr(feature = "debuggable", debuggable(summary = "{len} items"))]
pub struct Stack {
#[cfg_attr(feature = "debuggable", debuggable(hide))]
len: usize,
#[cfg_attr(feature = "debuggable", debuggable(items, len = "len"))]
xs: [u32; 4],
}With the feature off, nothing changes: no dependency, no MSRV bump, nothing in the binary.
Shaping the value
| Attribute | On | Effect |
|---|---|---|
summary = "..." |
struct, enum variant | One-line summary. {field} (or {0} for a tuple field) inserts a field, {#} the number of elements; {{ and }} are literal braces. |
hide |
field | Leave the field out. PhantomData fields are left out automatically. |
rename = "..." |
field | Show the field under another name. |
text |
field | Show bytes as a string, "hello": a [u8; N], Vec<u8> or byte pointer. Invalid UTF-8 shows as \xNN. |
Collections
| Attribute | On | Effect |
|---|---|---|
items |
field | Show the field's elements in its place: a Vec<T>, an array [T; N], or a *const T, *mut T or NonNull<T> with len. MaybeUninit<T> elements are shown as T. |
len = "field" |
with items or text |
How many elements to show: for a Vec or array, at most this many; for a pointer, required. |
only = "..." |
with items |
Show only some elements: those in a given enum variant ("Occupied"), or those where a field is non-zero, optionally masked ("version & 1"). For slab-, arena- and slot-map-style collections. |
value = "path" |
with items |
Show a field of each element instead of the whole element ("0", "u.value"). |
items = "path", len = "path" |
struct, enum | One place the elements can be, for collections that move between an inline buffer and the heap (smallvec, tinyvec). Repeat it for each place; the first that exists in the value is shown. |
Full reference with examples: docs.rs/debuggable.
| GDB | LLDB | VS Code (CodeLLDB) | |
|---|---|---|---|
| Linux (x86-64) | 15 | 18, 20, 22 | yes |
| macOS | n/a | Apple LLDB | expected, not yet tested |
| Windows (MSVC) | not yet | not yet | not yet |
On Windows nothing is emitted, so crates that use debuggable still build unchanged.
CI runs every GDB and LLDB version above on every commit, in debug, release, thin-LTO and fat-LTO builds. VS Code was tested by hand on Linux. Details and known issues are in compatibility.
Limitations
- Types defined inside a function body aren't matched by debuggers.
cargo debuggable doctorpoints them out. - Summaries refer to fields by name. There are no expressions or format specs.
- In plain
gdb, standard library types such asStringandVecinside your summaries show raw.rust-gdbloads rustc's printers for them.
The derive embeds a small JSON description of each type in the binary. On Linux it goes in a
section that GDB loads automatically, together with a small runtime that renders the
descriptions, so GDB only needs to trust your build directory. LLDB can't load anything from a
binary, so cargo debuggable setup installs a loader that reads the same descriptions. More in
how it works.
See CONTRIBUTING.md for the layout, how to run each tier of tests, and what a schema or runtime change involves.
Licensed under either of Apache License, Version 2.0 or MIT license at your option.
Unless you explicitly state otherwise, any contribution intentionally submitted for inclusion in this crate by you, as defined in the Apache-2.0 license, shall be dual licensed as above, without any additional terms or conditions.